With the help of coordinate reference systems (CRS) every place on the earth can be specified by a set of three numbers, called coordinates. In general CRS can be divided into projected coordinate reference systems (also called Cartesian or rectangular coordinate reference systems) and geographic coordinate reference systems.
Geographic Coordinate Reference Systems
The use of Geographic Coordinate Reference Systems is very common. They use degrees of latitude and longitude and sometimes also a height value to describe a location on the earth’s surface. The most popular is called WGS 84.
Lines of latitude run parallel to the equator and divide the earth into 180 equally spaced sections from North to South (or South to North). The reference line for latitude is the equator and each hemisphere is divided into ninety sections, each representing one degree of latitude. In the northern hemisphere, degrees of latitude are measured from zero at the equator to ninety at the north pole. In the southern hemisphere, degrees of latitude are measured from zero at the equator to ninety degrees at the south pole. To simplify the digitisation of maps, degrees of latitude in the southern hemisphere are often assigned negative values (0 to -90°). Wherever you are on the earth’s surface, the distance between the lines of latitude is the same (60 nautical miles).
Figure : Geographical Coordinate Reference System

Lines of longitude, on the other hand, do not stand up so well to the standard of uniformity. Lines of longitude run perpendicular to the equator and converge at the poles. The reference line for longitude (the prime meridian) runs from the North pole to the South pole through Greenwich, England. Subsequent lines of longitude are measured from zero to 180 degrees East or West of the prime meridian. Note that values West of the prime meridian are assigned negative values for use in digital mapping applications.
At the equator, and only at the equator, the distance represented by one line of longitude is equal to the distance represented by one degree of latitude. As you move towards the poles, the distance between lines of longitude becomes progressively less, until, at the exact location of the pole, all 360° of longitude are represented by a single point that you could put your finger on. Using the geographic coordinate system, we have a grid of lines dividing the earth into squares that cover approximately 12363.365 square kilometres at the equator — a good start, but not very useful for determining the location of anything within that square.
To be truly useful, a map grid must be divided into small enough sections so that they can be used to describe (with an acceptable level of accuracy) the location of a point on the map. To accomplish this, degrees are divided into minutes (') and seconds ("). There are sixty minutes in a degree, and sixty seconds in a minute (3600 seconds in a degree). So, at the equator, one second of latitude or longitude = 30.87624 meters
Projected Coordinate Reference Systems
A two-dimensional coordinate reference system is commonly defined by two axes. At right angles to each other, they form a so called XY-plane (see figure 6.4). The horizontal axis is normally labelled X, and the vertical axis is normally labelled Y. In a three-dimensional coordinate reference system, another axis, normally labelled Z, is added. It is also at right angles to the X and Y axes. The Z axis provides the third dimension of space. Every point that is expressed in spherical coordinates can be expressed as an X Y Z coordinate.
Figure : Projected CRS

Two and three dimensional coordinate reference systems.
A projected coordinate reference system in the southern hemisphere (south of the equator) normally has its origin on the equator at a specific Longitude. This means that the Y-values increase southwards and the X-values increase to the West. In the northern hemisphere (north of the equator) the origin is also the equator at a specific Longitude. However, now the Y- values increase northwards and the X-values increase to the East. In the following section, we describe a projected coordinate reference system, called Universal Transverse Mercator (UTM) often used for South Africa.
Universal Transverse Mercator (UTM) CRS
The Universal Transverse Mercator (UTM) coordinate reference system has its origin on the equator at a specific Longitude. Now the Y-values increase southwards and the X-values increase to the West. The UTM CRS is a global map projection. This means, it is generally used all over the world. But as already described in the section ‘accuracy of map projections’ above, the larger the area (for example South Africa) the more distortion of angular conformity, distance and area occur. To avoid too much distortion, the world is divided into 60 equal zones that are all 6 degrees wide in longitude from East to West. The UTM zones are numbered 1 to 60, starting at the international date line, also called Greenwich meridian, (zone 1 at 180 degrees West longitude) and progressing East back to the international date line (zone 60 at 180 degrees East longitude) as shown in Figure 6.5
Figure 6.5: Universal Transverse Mercator
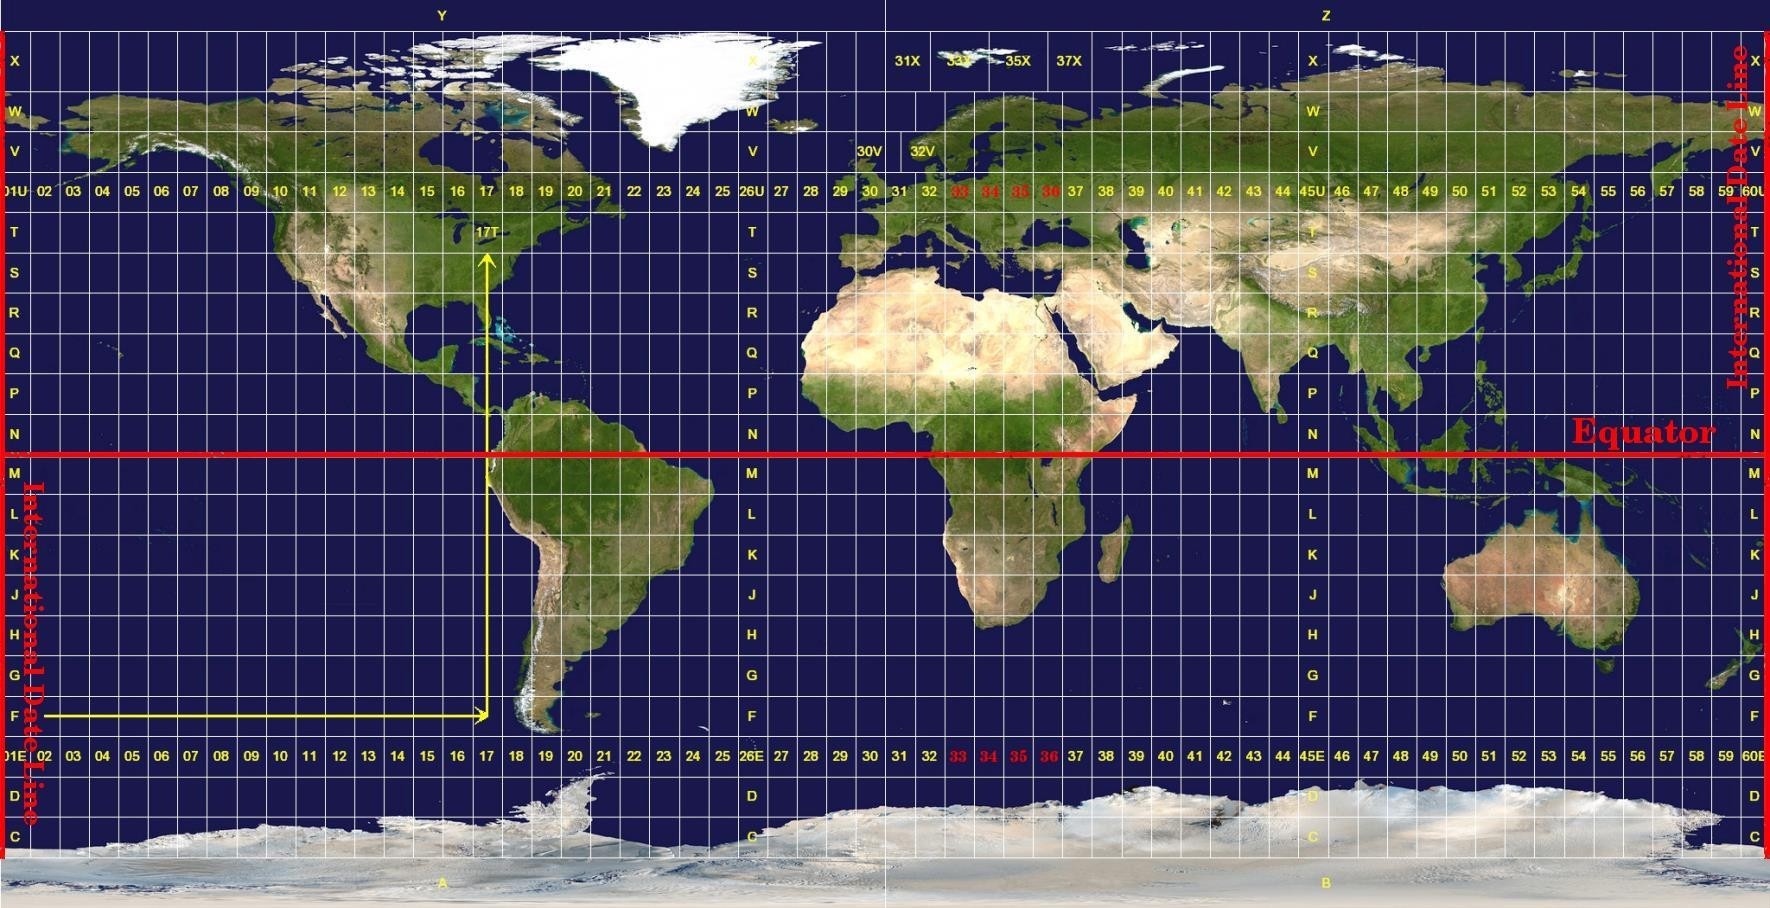
The Universal Transverse Mercator zones
Normally for each of the 60 zones, comprising 6 degrees each, in practice three parameters are very important
- Central Meridian: the longitude which possesses most centrally through the area of interest (AOI). In Kenya, it is normally 36 degrees
- False Easting: usually +500,000 meters to make all coordinate figures positive. This happens for all areas left of central meridian, which ordinarily would be negative
- False Northing: usually +10,000,000 for all areas in the southern hemisphere, which ordinarily would be negative.
On-The-Fly Projection
As you can probably imagine, there might be a situation where the data you want to use in a GIS are projected in different coordinate reference systems. For example, you might get a vector layer showing the boundaries of South Africa projected in UTM 35S and another vector layer with point information about rainfall provided in the geographic coordinate system WGS 84. In GIS these two vector layers are placed in totally different areas of the map window, because they have different projections.
To solve this problem, many GIS include a functionality called on-the-fly projection. It means, that you can define a certain projection when you start the GIS and all layers that you then load, no matter what coordinate reference system they have, will be automatically displayed in the projection you defined. This functionality allows you to overlay layers within the map window of your GIS, even though they may be in different reference systems.